Adding chart title in excel is a good practice while representing your data in graphical manner in Microsoft Excel 2003,2007,2010,2013. Readers can easily understand what is the particular chart is for. We will see the different ways of adding charts in excel. For example we can add the chart title from chart tools, we can link the chart title to a cell. We can also link chart title to a pivot table field headers.
How to add chart title in Excel
Adding chart title in excel is depending on the data which you are representing on your charts. For examples, if you are showing a summary of sales by year wise. You can give the caption as ‘Yearly Sales (2005-2010)’. If you show this by month (monthly), period, Week (weekly) you can change the chart titles accordingly. Some time you will show and compare the different metrics and Categories in chart. You can give a chart title ‘Comparison of Category 1 and Category 2’. Or you can give Tend analysis, Category analysis,etc…
Adding Chart Title in Excel – Example Excel chart with sample data
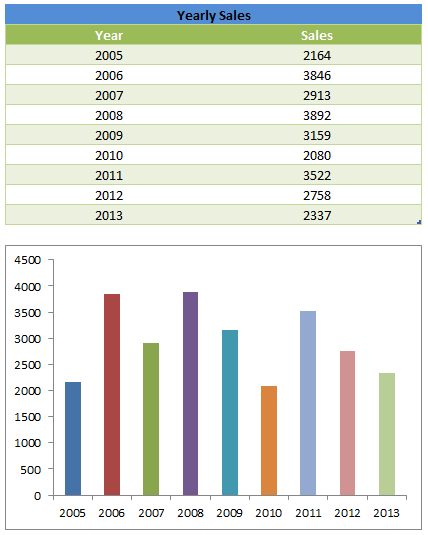
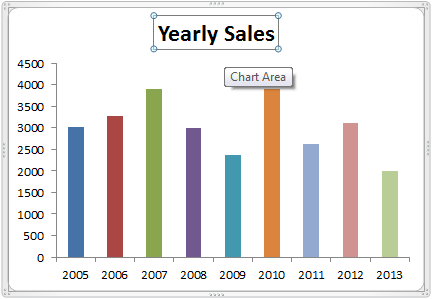
Here is the example data and sample chart created in Excel 2010. We will use this basic chart to understand “Adding chart title in excel” concept. Samples sales data by year from 2005 to 2013. Year and Sales are the two fields and the Sales data is generated using random function.
When you select some data and insert a chart, by default Excel will automatically generate the chart with a title. It is depending on the data and the number of columns you selected o plot the chart.
Adding chart title in excel
Adding chart title using chart menu tools in Excel ribbon
Now we will see how to add chart title in excel. We can use the chart utilities or tools in the chart ribbon menu. We can easily add the chart title using chart title commands in the excel ribbon menu. Follow the below steps to add the chart title in Excel.
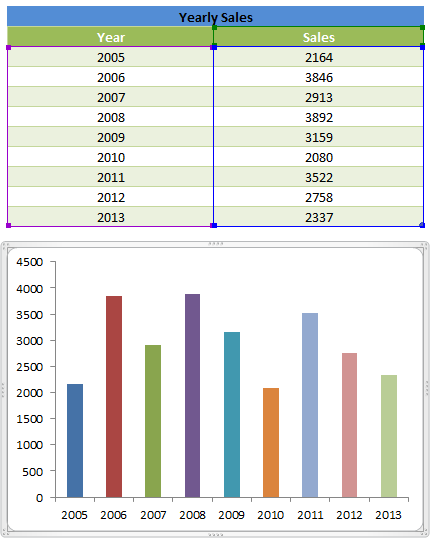
Select a Chart
Activate a chart which you want to add the title. You can take your mouse pointer on required chart and click to select the chart.
Adding chart title in excel – select a chart
Go to chart Tools and Chart Commands
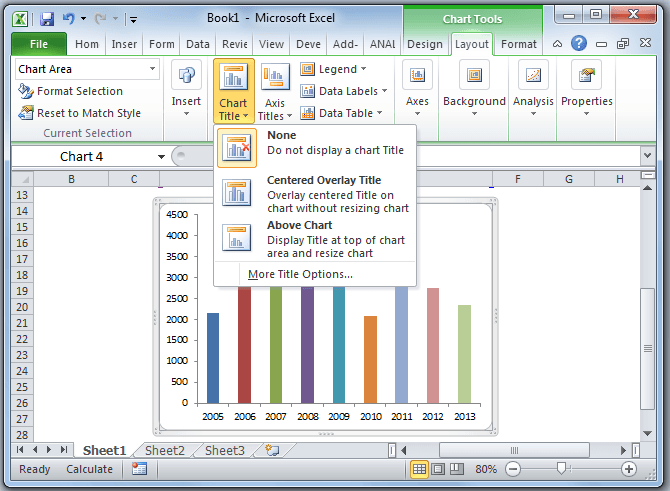
When you select any chart, you can see the chart tools in the ribbon menu. You can select the layout menu form Chart Tools and Go to Chart Title Commands to enable the chart title.
Adding chart title in excel – chart tools- chart commands
Choose Above Chart Command form Chart Title Commands
Now you can choose the Above Chart command from the chart Title Commands to enable the chart title. This will generate a chart title based on your chart data. If your data is single column or metric, this will give the column header as a chart title. Other wise it will print ‘Chart Title’.

Adding chart title in excel – choose above chart title command
Chart Title Commands
There are three commands available in chart title menu.
None
If you select this option, this will not display the chart title.
Centered Overly Title
This will enable the chart title. This will show the chat title without re-sizing the chart plot area.
Above Chart
This will enable the chart title. This will re-sizing the chart area and show the chart title above the chart plot area.
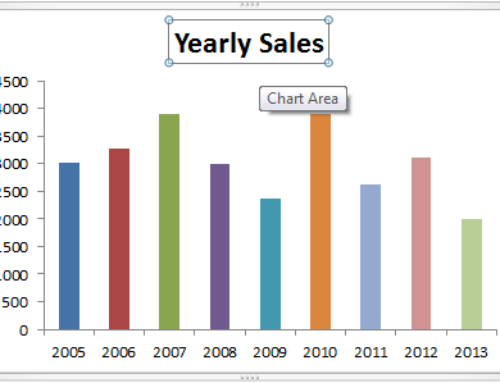
Changing Chart title in Excel
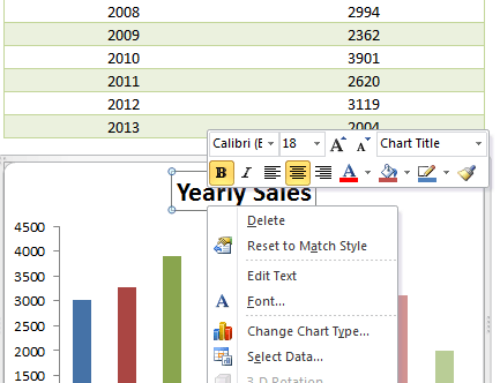
You can change the chart title by double selecting required chart in Excel worksheet. You can enter any text to change a chart title in excel.
Dynamic Chart Title by Linking and Reference to a Cell in Excel
Dynamic chart title can change itself automatically. We can link a chart title to any cell in the worksheet. Whenever we change some data and the chart title can change automatically. When you provide the cell reference, chart title equals to the cell and change automatically based on its formula. You can insert any content into a cell, content will be automatically shown in chart title. Cell can be any named range or any cell with Excel function in workbook.
Chart Titles Based on Pivot Table Filter Fields
We can also link the chart titles to Pivot Tables Filter Fields. whenever you change the Filer, Chart will be automatically change the title depends on the data which showing for.
Chart Titles Based on Pivot Table Filter Fields
Chart Titles Based on Condition and Formula
You can also provide the chart titles based on certain condition. You can write any formula or condition in any cell and then link the chart title to the Cell with conditional formula.
Chart Titles Based on Condition or Formula
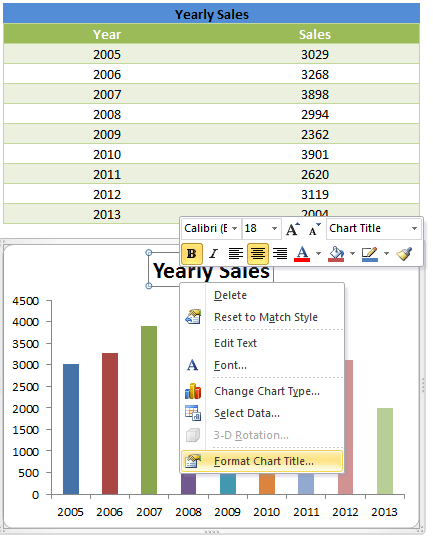
Formatting Chart Titles in Excel
We can format the chart title by changing boarder styles and alignment, chart title background color, border color, changing the font text to bold and underline and font size. It looks different when we have chart title with different colors.
Formatting Chart Titles in Excel
Chart sub-titles in Excel
You can use cells to provide sub heading or sub titles in the charts. Or you can use shapes in the Excel charts to show the chart titles or sub-titles in the charts. This can be controlled even more better.
VBA to Change and Format Chart Titles in Excel
Alternatively you can use Excel VBA to change and format the Chart titles. We will see more on this in advanced topics.

