

A project management dashboard is a single screen that shows how every project is doing — percentage complete, what is due this week, which milestones are coming, and what is at risk. This free Excel template gives you that dashboard, plus a Gantt chart, across as many projects as you need to track.
You enter projects and tasks on two sheets. The dashboard and the Gantt chart build themselves from that data.
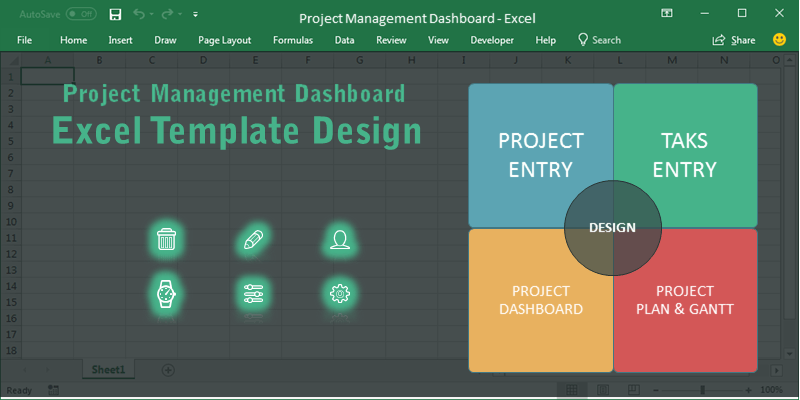
Project Management Dashboard Excel Template
Multiple projects in one workbook, with a dynamic dashboard and Gantt chart. Ships with 10 sample projects and 40 tasks you can clear and replace with your own.
Free. No sign-up. Excel 2007, 2010, 2013, 2016, 2019 and Microsoft 365 — Windows and Mac.
What the Project Dashboard Shows
The Dashboard sheet is the screen you put on a projector in a status meeting. Pick a project from the drop-down and it repopulates.
| Dashboard elements | |
|---|---|
| Overall progress | Percentage of tasks complete for the selected project, as a pie chart |
| Task status | Bar chart splitting tasks into new, in progress and completed |
| Due this week | Every task with a deadline inside the current week |
| Milestones | Key dates with start and end, so slippage is visible early |
| Top 3 risks | The risks worth raising with management, not a full risk register |
| Resources | Who is allocated, their role, and hours committed to this project |
| Objective & key notes | Background and anything else the status meeting needs to hear |
The Four Sheets
Two sheets for entering data, two for reading it. That separation is the whole design — you never type into a chart.
| Data entry | |
|---|---|
| Project Summary | List your projects here, one row each. Task counts, start and end dates, duration and percentage progress all calculate from the task data — you only type the project name |
| Data Sheet | Every task, with its project, owner, start date, days required and percentage progress. Enter tasks in any order and sort by project afterwards |
| Reading | |
| Project Plan | Select a project from the drop-down to see its tasks as a Gantt chart, with controls to change the visible date range |
| Dashboard | The high-level summary screen described above |
How to Use It
- Clear the sample data. The file ships with 10 projects and 40 tasks so the charts have something to show. Delete those rows from Project Summary and Data Sheet before you start — leave the table structure alone.
- Enter your projects in the Project Summary sheet. Names only; everything else calculates.
- Enter your tasks in the Data Sheet — project, task, owner, start date, days required, percentage progress. This is the sheet you will spend your time in.
- Open Project Plan and pick a project from the drop-down to see the Gantt chart.
- Open Dashboard, pick the project, and fill in objective, milestones, risks and notes.
- Share it. Export the Dashboard sheet as PDF, or copy it as a picture to paste into a status email.
Keeping It Current Without It Becoming a Chore
The failure mode for every dashboard template is that it goes stale in week three. Two habits prevent it:
- Update percentages once a week, not daily. A weekly rhythm before your status meeting is sustainable. Daily is not, and a dashboard nobody trusts is worse than none.
- Update from the task sheet only. Never adjust a number on the Dashboard directly — it will be overwritten the next time the project selector changes, and you will lose trust in the figures.
Tracking Multiple Projects
The template is built for a portfolio rather than a single project. Add as many projects as you need — the 10 supplied are illustration, not a limit.
- Project Summary gives you the portfolio view: every project, its progress, its dates
- Dashboard gives you the single-project view, switched by drop-down
- Tasks for all projects live in one Data Sheet, tagged by project name
That structure is why the file suits a PMO or anyone running several workstreams at once. One workbook, one place to update, any number of project views out of it.
Adapting the Template
| If you are running… | What to change |
|---|---|
| Construction projects | Add columns for permits, inspections and subcontractor to the Data Sheet. Use milestones for handover dates and phase completions |
| Software delivery | Add a sprint column and filter the Gantt by sprint. Use the risk block for blockers rather than long-term risks |
| Client-facing work | Add a billable-hours column against resources, and keep two versions of key notes — internal and client-facing |
| A PMO or portfolio | Use Project Summary as the primary view. Add a RAG status column and a sponsor column |
New columns in the Data Sheet are picked up automatically because it is a proper Excel table — click the last cell and press Tab to extend it.
Frequently Asked Questions
Is the project management dashboard template free?
Yes. Free to download and use at work, with no sign-up and no watermark.
How many projects can it handle?
As many as you need. The file ships with 10 projects and 40 tasks as sample data so the charts render, but you can clear those and add your own. Performance stays fine into the hundreds of tasks.
Does it work on Mac?
Yes. Excel 2007 and later on Windows, and Excel for Mac. It also opens in Google Sheets, though some chart formatting shifts on import.
Can I add my own columns?
Yes. The Data Sheet is an Excel table, so new columns extend automatically and formulas carry down. Nothing is locked.
How is this different from a Gantt chart template?
A Gantt chart shows one project’s schedule. This template includes a Gantt chart but adds the portfolio view, progress summaries, milestones, risks and resourcing — the things a status meeting needs beyond the timeline.
How often should I update it?
Once a week, before your status meeting. Update task percentages in the Data Sheet and everything else recalculates.
Can I share the dashboard without sharing the file?
Yes. Export the Dashboard sheet to PDF, or copy the dashboard area and paste it as a picture into an email or slide.
Related Templates
- MOM Format — Minutes of Meeting Template — record what was decided in the status meeting this dashboard drives
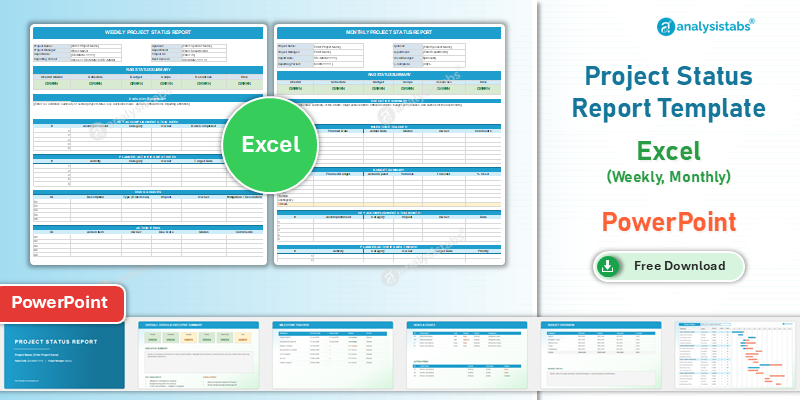
- Project Status Report Template — the written report that accompanies the dashboard
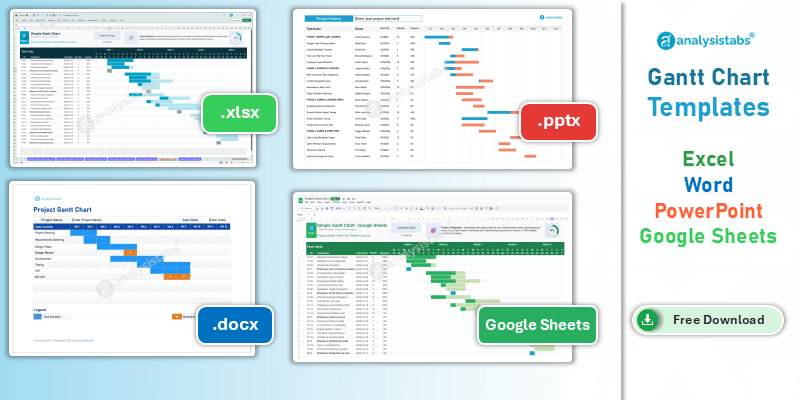
- Gantt Chart Template — if you only need the schedule view
- All Free Project Management Templates


Thank you for the template. I found it quite helpful. I have a question though, How do unprotect the other sheets
Hello, is there a password to unprotect the multiple project tracking spreadsheet? thank you very much
Please check our premium Templates for Unlocked the sheets