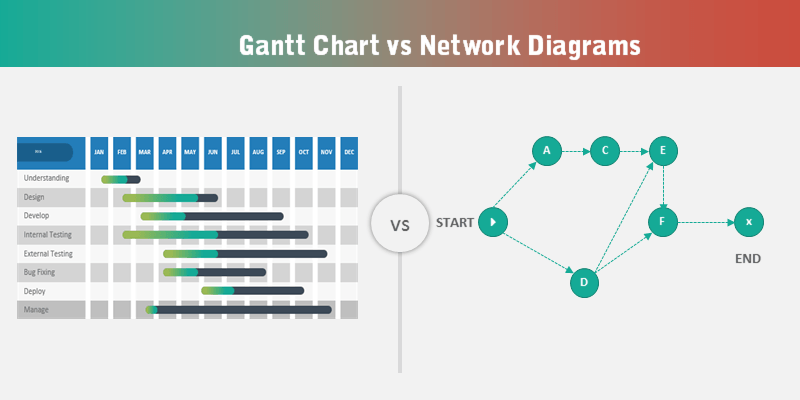
Let us see Difference between Gantt Chart vs Network Diagram in this topic. The main differences are: Gantt charts is a Stacked Bar Chart to represent Project Schedule in Graphical Representation. And the Networks diagram is Flow Chart representation of sequential workflow of the Project Tasks.
Difference between Gantt Chart and Network Diagram
Here are the list of difference between Gantt Chart and Network Diagram in a comparable table format. This helps to clearly understand the uses of the Gantt Chart and Network Diagrams in the Project Management. And we can see some Pros and Cons in each Type of Charts.
| Gantt Chart | Network Diagram |
|---|---|
| Gantt Chart is a Pictorial Representation of Project Schedules | Network Diagram is a Pictorial Representation of Project Work-flow |
| Focus is on Tasks and Time Management | Focus is on Milestones Work Sequential Order |
| In-depth Plan to understand of Project Tasks | High-level Plan to Understand the Project Work-flow |
| Project Time lines are Clearly Defined. For example, 1-Jan-2017 to 25-July-2017 for Task A | Estimated Time frames are defined. For example, 4 days, 2 weeks, 1 month for Milestone A. |
| Effective Resource Allocation is can be done using Gantt Format | It is not possible using Network Diagram |
| Project Progress is captured | Can not Capture the % Progress |
| Project Status is updated. Like New, Open, In progress, Completed, On hold | We can not Updated Project Status |
| Project Complexity Details recorded. For Example, Level 2, Level 2, Level 3. | We will not record project complexity. |
| We can add Task description and Remarks for each task and update any time if required | We can not enter remarks or task description here |
| Easy to modify and edit the information | Difficult to change the information |
| Stacked Bar Chart is used to Create Gantt Chart | Process Flow Chart diagrams are used to create Network diagram |
Conclusion
Gantt chart is visual representation of Project Schedules. We can use this for effectively Manage Project Resource, Time and Activities. And a Network Diagram is a linking display of the relationships among all project activities. And a Network diagram is used to represent the various tasks of the project in sequential order by using linkages.


