CELL Function in Excel
PNRao2022-06-17T03:54:52+05:30CELL Function in Excel - formula returns information about the contents, formatting or location of a given cell. Learn Formulas, Excel and VBA with examples
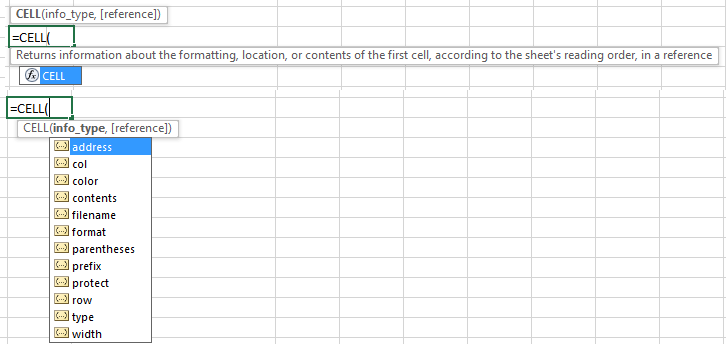
CELL Function in Excel - formula returns information about the contents, formatting or location of a given cell. Learn Formulas, Excel and VBA with examples
In this section I will introduce the basic features of Microsoft Excel, one of the tools in the MS Office Package. It is a spreadsheet application used to enter the data (text, numbers, etc...) to perform calculations, analysis and store it in a file. There are many built-in functions and formulas allow you to perform calculations and you can create attractive, readable presentations and rich visualized dashboards including tables, charts,etc...
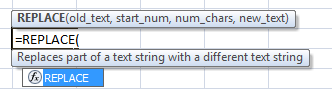
REPLACE Function in Excel - formula replaces a sequence of characters/words in a string with another set of characters/words. Learn Formulas with examples .
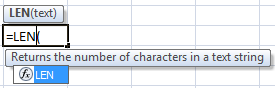
LEN Function in Excel - formula Returns the length of the specified string. Learn Formulas, Excel and VBA with examples explained in our free tutorials.
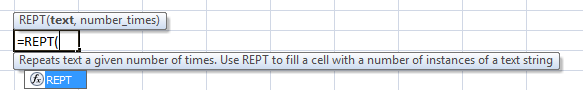
REPT Function in Excel - formula returns a repeated text value a specified number of times. Learn Formulas, Excel and VBA examples in our free tutorials.
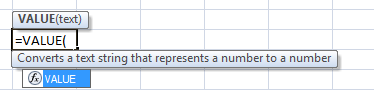
VALUE Function in Excel - formula helps to convert a number in a text format into a number format. Learn Formulas, Excel and VBA examples free tutorials.
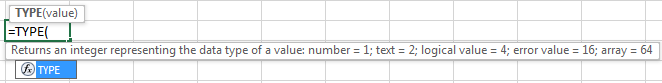
TYPE Function in Excel - formula returns information (integer) about the data type of a supplied value. Learn more Formulas, Excel and VBA with examples.
.
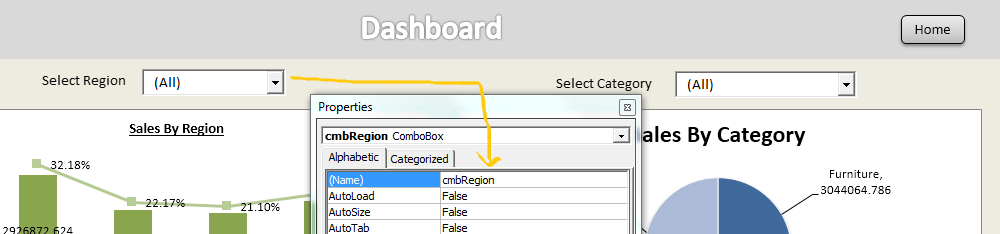
This is a simple interactive dashboard developed using VBA, I have used a the last updated simple sample dashboard and enhanced it by using VBA. Here you can learn how to develop a simple interactive dashboard using sales data. In this dasboard:
This is a simple dashboard, I have used a dummy store data for illustration purpose. Read more and learn to build a simple sales performance dashboard. Example dashboard is attched in the post, you can download and have a look into the file. In this dasboard:
NA Function in Excel - formula returns excel #NA Error. Learn more Formulas, Excel and VBA concepts with examples explained in our free tutorials.
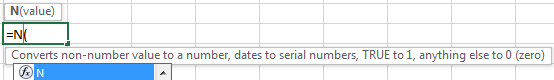
N Function in Excel- formula converts data into numeric values, converts a non-number value to a number, a date to a serial number, the logical value TRUE to 1 and all other values to 0
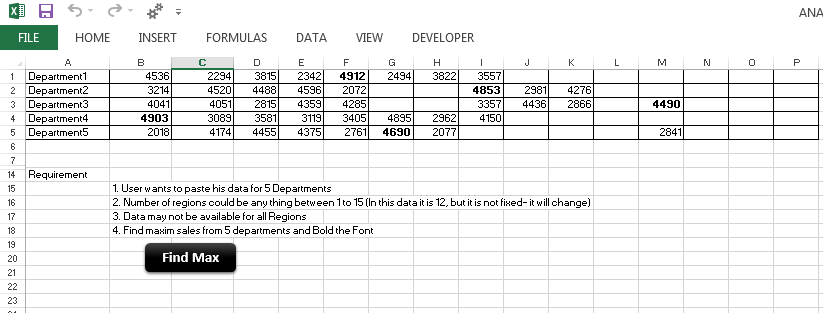
Description: There are certain situations where we perform some tasks [...]
Effectively Manage Your
Projects and Resources
Analysistabs was created by PNRao, a project management professional with over 15 years of experience across finance, telecom, healthcare, and retail. What started as a personal Excel blog in 2012 has grown into a resource used by 50,000+ professionals worldwide. Every template is built from real-world project experience — not generic AI-generated content.
Free Templates
Premium Templates
Free project management templates and Excel automation guides by PNRao. Download professional templates for project planning, budgets, dashboards, timelines, and more. Compatible with Excel 365, 2024, and 2021. Trusted by 50,000+ professionals since 2012.