Excel Dashboards help you to understand huge amount of the data in a simple and easiest way with the help of Graphs, Tables and Insights.

Creating Dashboards in Excel – Dashboard Creation Using Sales Data
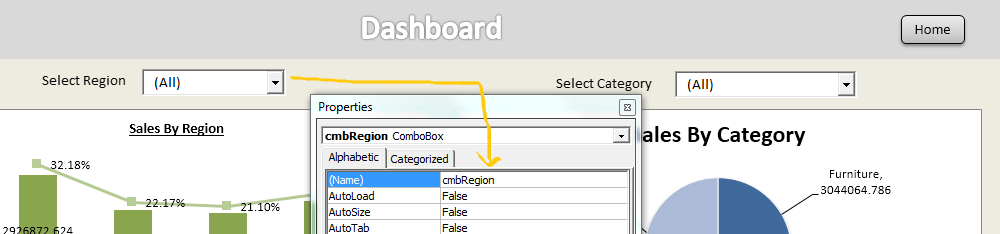
PNRao2022-06-17T03:53:45+00:00This is a simple dashboard, I have used a dummy store data for illustration purpose. Read more and learn to build a simple sales performance dashboard. Example dashboard is attched in the post, you can download and have a look into the file. In this dasboard: